Project #10 Translation Device
Bike Incident mapping data around you
Informative Data Visualization resource
Read the map by looking for the type of incident: Stolen / Unidentified / Accident. It will show up to 100 results in the area surrounding you.
My visualization doesn't keep any data on my servers or collect any user data through p5.js or glitch.
Topic Overview
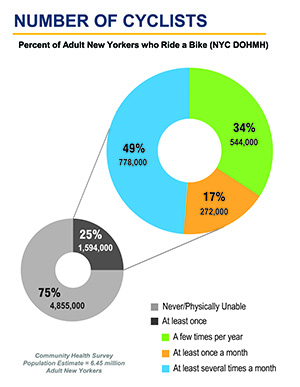
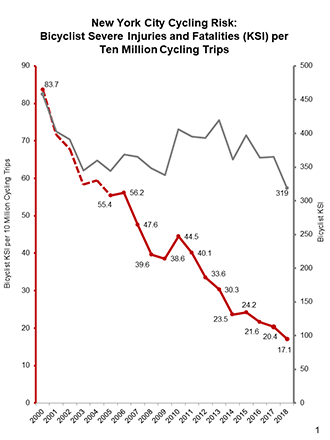
As the biking culture continues to grow in a city like New York, especially with the movement towards greener practice, it is important to create maps that carry data that relate to: routes, safety, and accidents/incidents about biking. Having more intel into these conditions, with about 900,000 New Yorkers regularly riding bikes around the city, it allows the city to create better conditions for safety: adding routes where there is none, and creating a better system to reduce theft and accidents. Bike accidents can be very dangerous, and the more bikers are equipped with knowledge and data about this issue, the better they can protect themselves and others. There has been a serious decrease in cycling risk over the past decade, and that is due to increasing safety measures spread around the city. Further, having maps that detail biking routes that have been integral in keeping cyclists protected from other vehicles is crucial. Creating this map that captures the number of incidents (theft, crash, unknown) in relation to bike lanes, gives an additional look into how these two data points correlate. As cycling becomes more and more a mode of commuting, especially seeing a rise during the pandemic when taking public transportation was less appealing, I was interested to explore how the state of biking/cycling in New York City, how equipped the city is and has been. Bicycle theft and accidents are also a very common experience in the city, and I wanted to overlay this data on top of the map of the city to understand better how they are spread out, how often they happen, and whether or not bike lanes play a role in shaping the frequency of incidents.
Topic Research
Cycling in the City Trends Over Time- 1,301 lane miles of bike lanes installed in New York City as of 2019
- 501 lane miles of protected bike lanes installed in New York City as of 2019
- On a typical day, there are over 510,000 cycling trips made in New York City
Ridership Stats, Risks, and Crash Data
Bicycle Ridership and Safety- Female commuter cycling increased more than four times faster than male commuter cycling, 2015-2018
- 6.2% average annual growth rate of daily cycling, 2013-2018
- 35% growth in daily cycling, 2013-2018
Design Process
Bike Incident mapping data by Bike Index! created by BikeWise.org I found BikeWise API which is an open source on bike information by geoJSON location https://github.com/bikeindex/bikewise#readme
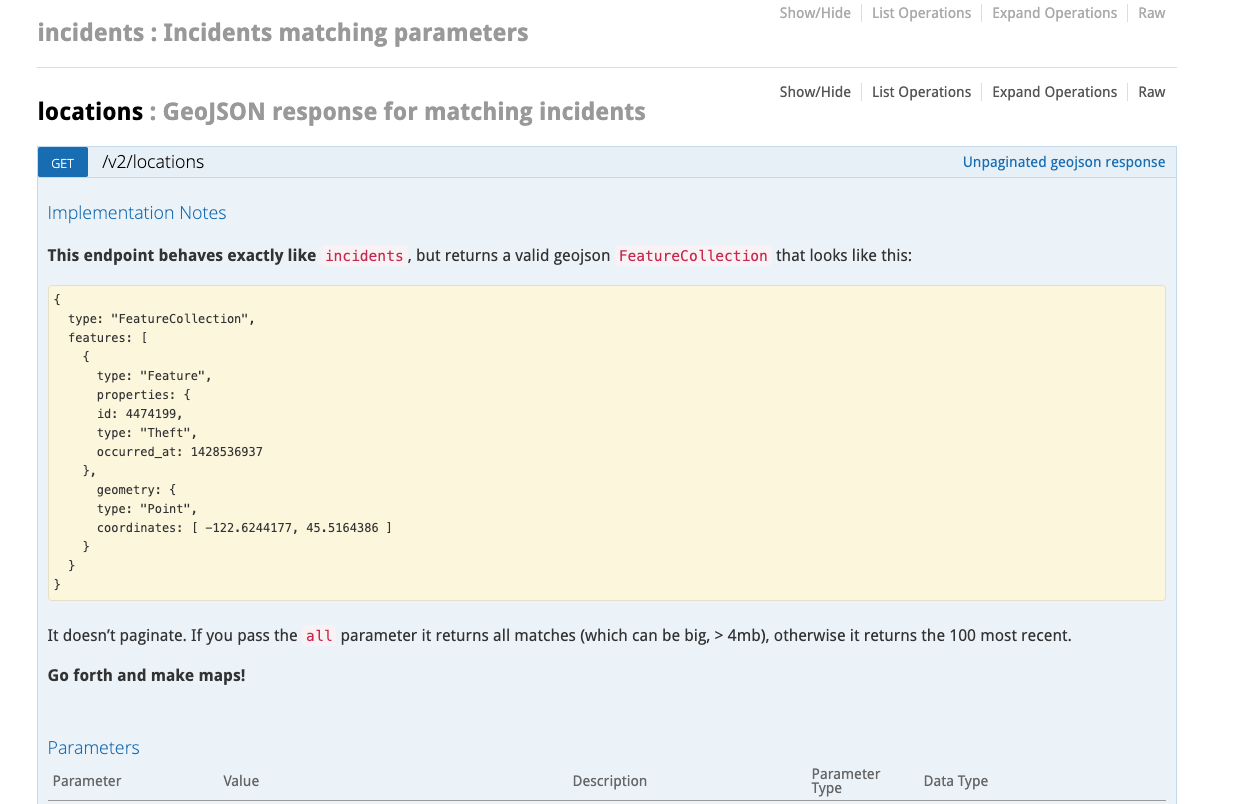
"path": "/locations", "description: GeoJSON response for matching incidents"
BikeWise is a place to learn about and report bike crashes, hazards, and thefts. This project intends to provide a powerful, universal way to access biking incident data for data scientists and developers.
BikeWise has an open, RESTful API.
Every day incidents for the past 30 days are committed to geojson_data/recent incidents.geojson and all incidents are committed to geojson_data/all.geojson. Both are geojson FeatureCollections, generated by calling the locations endpoint of the API.
Documentation
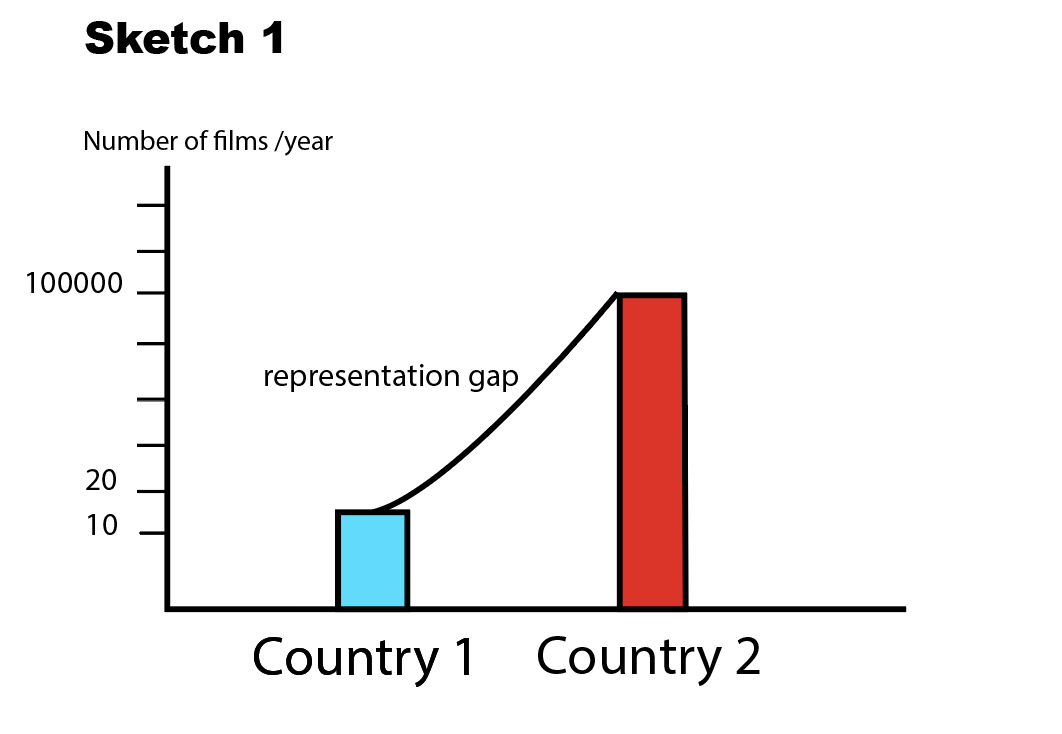
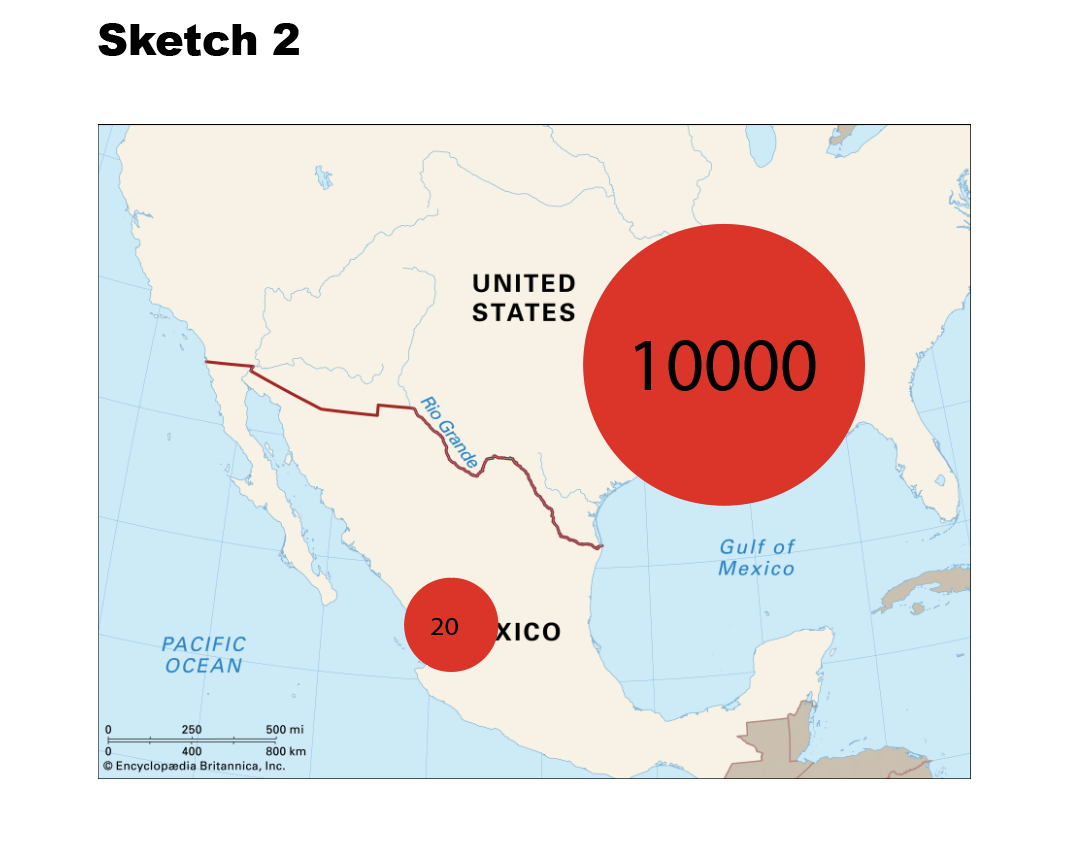
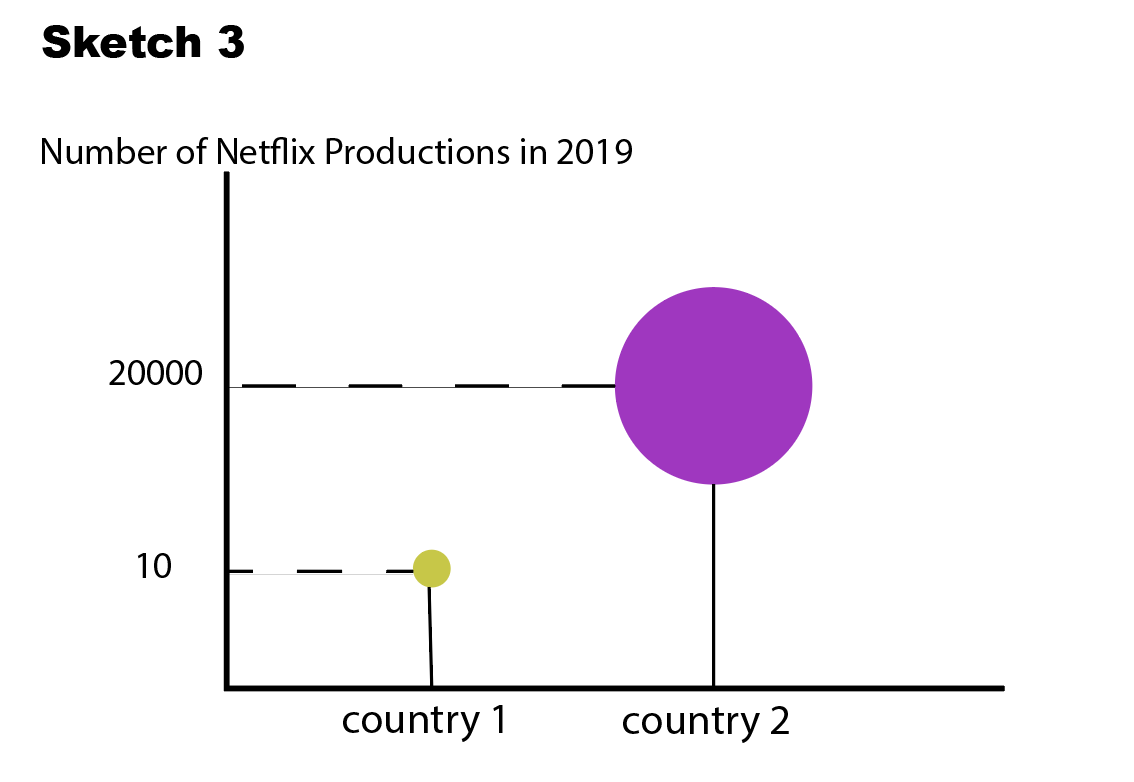
I formed the below sketches based on another topic which I was working on in the beginning of my research
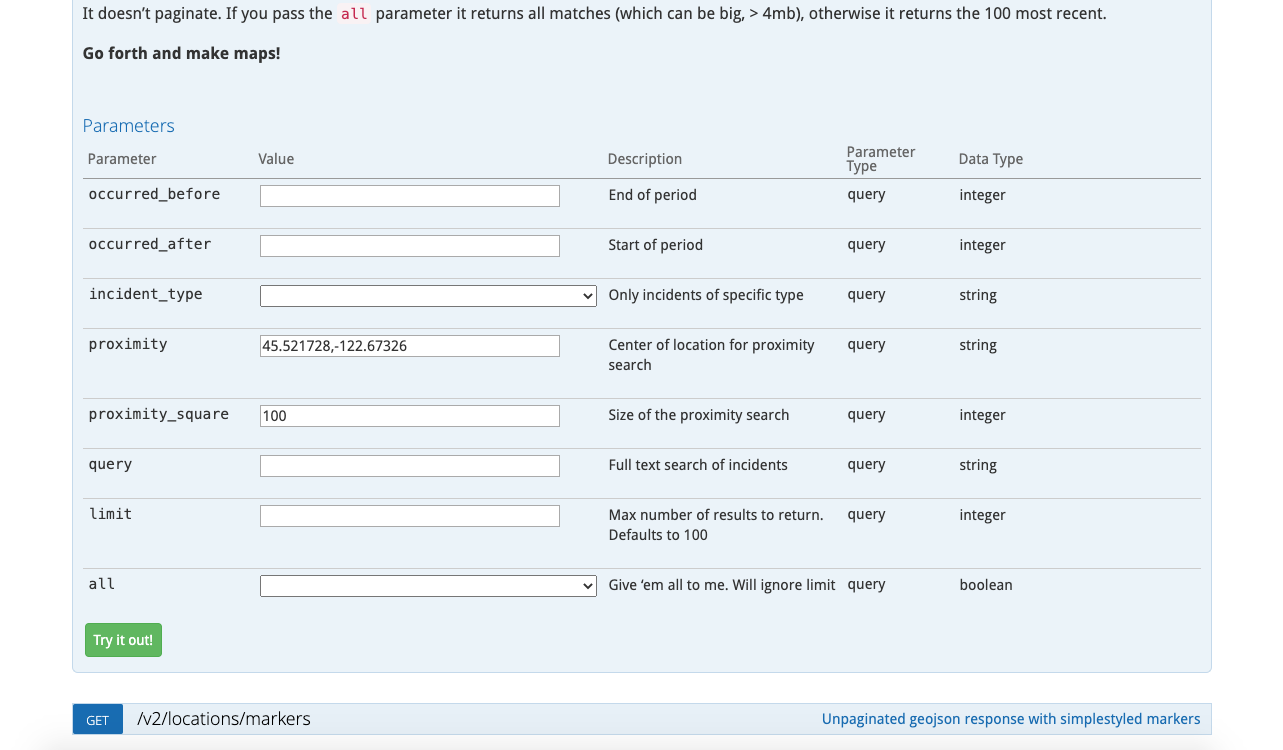
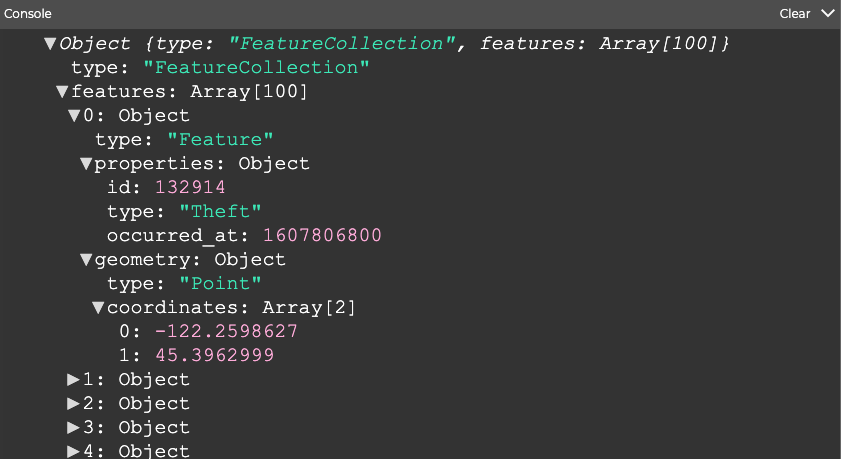
The screenshots below are from the API documentation. The pages were quite helpful to be able to read the API data and parse it.
Reflection
This project was very educational in how to approach data in a relational way, and to view different data sets in context of each other. After researching and further exploring this topic, I found that bike routes/lanes help cities that are as dense as New York keep their cyclist safe and help maintain the practice of biking as a viable and desired mode of transportation. Cycling has many benefits that relate to health and the environment, and unfortunately it can be a dangerous activity in a high-traffic city. About 2 million New Yorkers have chosen biking at least once in the past year. In NYC alone, there has been a high increase (355) in commuter cycling in comparison to other peer cities (16%). About 1800 lane miles of bike lanes were introduced in 2019 increasing the safety of riding a bike in the city. Female commuter cyclists increased four times faster than male commuter cyclists over the past couple of years. This information is very crucial, and important to view against the data of crashes, thefts, and incidents in order to assess the situation and better the conditions of cyclists and decrease the number of crashes and thefts around the city.
It was great learning to pull out data and work with datasets. This empowered me with a tool to show disparities and discrepencies in certain existing realities. My entire approach to this project was applying feminist data principles. My search for the API was looking at and challenging what gets counted, and when that search yielded no results, I had to pivot for the sake of the deadline. I also dug deep in my search in an effort to challenge power, and to really look for what seemed to be an unlikely data set. It got me thinking about what gets counted, why, and by whom. And all these things matter in the search for a dataset. The Be Bike Wise dataset is a community led project to protect bikers from street harm. I decided to focus on incidents of theft because that is a prevailing problem for bikers in cities. Localizing and highlighting theft informs bikers and allows them to better navigate their surroundings.
Having publicly available data is a valuable resource which should be utilize by technologists, especially when looking at topics that could use some visualization.
Further Reflection on the Process
Finding the right APIs was very difficult. I looked for APIs about female-identifying members of the LGBTQ community who are either business founders or who work in tech. It was not almost impossible to source this data. I then looked into APIs about women win general who own small businesses which was available through the government. I then pivoted to look at women who study science and engineering and wanted to compare that to women who are working in science and engineering. I found the search for APIs quite challenging since most of what I was interested in exploring and visualizing was not available. Data that was not easily accessible and in some cases missing altogether. The last two APIs that I wanted to work with I found through the Census which proved to be a very difficult set to work with. Government data sets are very expansive and hold a lot of data. The search took up a lot of time as I was nearing the deadline and I really wanted to work on a topic that mattered to me. But the search was very telling in terms of what data is available and accessible as opposed to what is not, and that gap became very interesting.
I tried working with several concepts and 4 other APIs which lead to a dead end after spending time dissecting their data and trying to get to the endpoint requests. The process of allocating a convenient API and an intersting and valuable topic was very challenging and time consuming and the fact that I resorted to this topic is satisfying for the time being; however, I will be workig with the other API which I found to develop visualizations for other topics.